There are two different categories of classic chart
patterns: Bullish trend reversal and the Bearish trend reversal chart patterns.
Classic is a name used to identify a collection of
formations that typically have a longer-time horizon (greater than 13 trading
days) and that have noticeable price swings such that the price swings shape
characteristic patterns. The names of classic formations usually indicate the
shape of the formation such as the Wedge, Cup and Handle, Head and Shoulders
Top, Descending Triangle and so on.
Chart trading patterns are commonly habitual price
patterns that are common to all markets. Stock charts are used to ascertain a
continuance, a reversal, or a consolidation of a trend. Most chart patterns
have a more bullish or bearish prejudice. Other patterns require a breakout
confirmation before the direction of the trend can be established.
Trading with technical analysis requires correctly identifying chart patterns. Technical analysis is the study of price history to determine future trading opportunities. Price history in the form of a price chart is the visual representation of where prices have been, where buyers and sellers lurk, and often times the trading psychology at work in the market. If human emotion drives buying and selling behavior, then chart patterns can help to determine where such emotions may next surface. Chart patterns are the depiction of trading psychology in motion.
Cup and Handle Pattern
The cup and handle pattern is a well-known chart
pattern, which is a continuation setup for higher prices.
Cup and handle patterns are found within uptrends,
and are named for their appearance which resembles a cup and handle. This
pattern is the result of a resting period in the stock, with the round cup
shape followed by narrow price action which forms the appearance of the
handle. The technical buy point is as the stock clears the handle area to
the upside, ideally on volume expansion.
Bull Flag – Bull Flag Pattern
The bull flag pattern is found within an uptrend
in a stock. This pattern is named for the resemblance of a flag on a
pole. The bull flag is a continuation pattern which only slightly retraces
the advance preceding it. The technical buy point is when price
penetrates the upper trend line of the flag area, ideally on volume expansion.
Bear Flag – Bear Flag Pattern
The bear flag pattern is found in a downtrend
stock. This pattern is named for the resemblance of an inverted flag on a
pole. The bear flag is a continuation pattern which only slightly
retraces the decline preceding it. The technical sell point is when price
penetrates the lower trend line of the flag area, ideally on volume expansion.
Bull Pennant – Bull Pennant Pattern
The bull pennant pattern is found within an uptrend
in a stock. This pattern is named for the resemblance of a pennant on a
pole. The bull pennant is a continuation pattern with narrowing price
action following a strong advance. The technical buy point is when price
penetrates the upper trend line of the pennant area, ideally on volume
expansion.
Bear Pennant – Bear Pennant Pattern
The bear pennant pattern is found within a downtrend
stock. This pattern is named for the resemblance of an inverted
pennant on a pole. The bear pennant is a continuation pattern with
narrowing price action following a constant decline. The technical sell
point is when price penetrates the lower trend line of the pennant area,
ideally on volume expansion.
Symmetrical Triangle – Symmetrical
Triangle Pattern
Symmetrical triangles are usually continuation
patterns with converging trend lines. The technical buy point from a
symmetrical triangle is the upside break, while a downside break is a technical
sell signal. Ideally, a stock breaks out from a symmetrical triangle
prior to reaching the apex of the triangle with volume expansion.
Ascending Triangle – Ascending Triangle
Pattern
Ascending triangle patterns are bullish and often
form within uptrends in stocks as continuation patterns. The
ascending triangle pattern resembles a narrowing triangle with a horizontal
line of overhead resistance for the stock and an ascending trend line or rising
trend line beneath the stock. The overhead resistance temporarily
prevents the stock from advancing higher, while the rising trend line beneath
the stock signals that buyers are still present. An upside penetration of
the upper horizontal trend line is a technical buy signal for a stock breaking
out from an ascending triangle pattern.
Descending Triangle – Descending
Triangle Pattern
Descending triangle patterns are bearish and often
form within downtrends in stocks as continuation patterns. The descending
triangle pattern resembles a narrowing triangle with a horizontal line of
support beneath the stock and a descending trend line or downtrend line
above the stock. The horizontal trend line serves as support which
temporarily prevents the stock from declining, while the descending trend line
above the stock signals that sellers are still present. A downside
penetration of the horizontal trend line is a technical sell signal for a stock
breaking down from a descending triangle pattern, and indicates distribution
will follow.
Descending Channel – Descending Channel
Pattern
Descending channel patterns are short-term bearish
in that a stock moves lower within a descending channel, but they often form
within longer-term uptrends as continuation patterns. The descending
channel pattern is often followed by higher prices, but only after an upside
penetration of the upper trend line. The stock will continue channeling
downward until it is able to break either the upper or lower trend line.
An upside break is bullish, while a downside break is bearish.
Ascending Channel – Rising Channel
Ascending channel patterns or rising channels are
short-term bullish in that a stock moves higher within an ascending channel,
but these patterns often form within longer-term downtrends as continuation
patterns. The ascending channel pattern is often followed by lower
prices, but only after a downside penetration of the lower trend line. The
stock will continue channeling upward until it is able to break either the
upper or lower trend line. An upside break is bullish, while a downside
break is bearish.
Double Top – Double Top Pattern
A double top is a reversal pattern which occurs
following an extended uptrend. This bearish pattern is named for the pair
of peaks which form when price is unable to achieve a new high. The sell
or short sell signal is when price breaks below the reaction low which
formed between the two peaks.
Double Bottom – Double Bottom Pattern
A double bottom is a reversal pattern which occurs
following an extended downtrend. This bullish pattern is named for
the pair of lows which form when price is unable to achieve a new low.
The buy signal is when price breaks above the reaction high which formed
between the two lows.
Head and Shoulders Top
A head and shoulders top is a reversal pattern which
occurs following an extended uptrend. This bearish pattern is
named for the three highs which form a left shoulder, head, and right
shoulder. The sell or short sell signal is when price breaks below
the neckline which forms along the reaction lows.
Head and Shoulders Bottom
A head and shoulders bottom is a reversal pattern
which occurs following an extended downtrend. This bullish pattern is
named for the three lows which resemble an inverted head and shoulders
pattern. The buy signal is when price breaks above the neckline.
Falling Wedge – Falling Wedge Pattern
Falling wedge patterns can be found in both uptrends
and downtrends, but taking notice of the prevailing trend will help you
determine whether the falling wedge signals a continuation pattern or a
reversal pattern. In both cases, falling wedge patterns are generally
resolved to the upside.
Rising Wedge – Rising Wedge Pattern
Rising wedge patterns are bearish and are found at
the ends of uptrends as well as during downtrends. In either case, a
downside break from a rising wedge pattern is a technical sell signal or short
sell signal. The rising wedge pattern is a reliable short sell
indication.
Triple Top – Triple Top Pattern
A triple top is a reversal pattern composed of three
failed attempts at making new highs in the same area, followed by a subsequent
downside break of support. This pattern is rare, but a very reliable sell
signal.
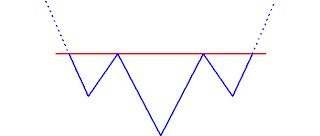
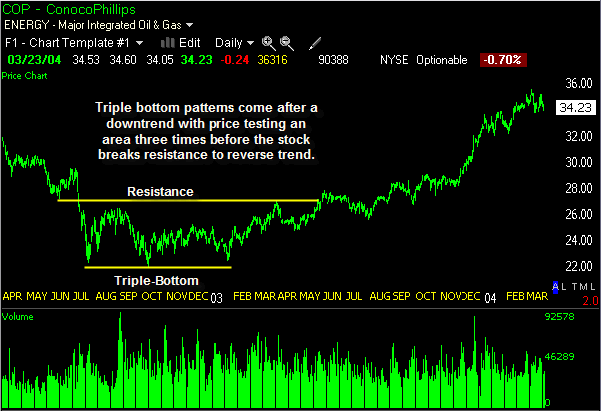
Triple Bottom – Triple Bottom Pattern
A triple bottom is a reversal pattern with bullish
implications composed of three failed attempts at making new lows in the same
area, followed by a price move up through resistance. This pattern is
rare, but a very reliable buy signal.
If you take my advices and win your trades, just remember me. Thanks


No comments :
Post a Comment